Qlik Multiple filters for showing metrics
08 Nov 2025
Difficulty ★★★☆☆
IN PROGRESSS!!
Different variables can interact to hide, show or calculate metrics.
STORY:
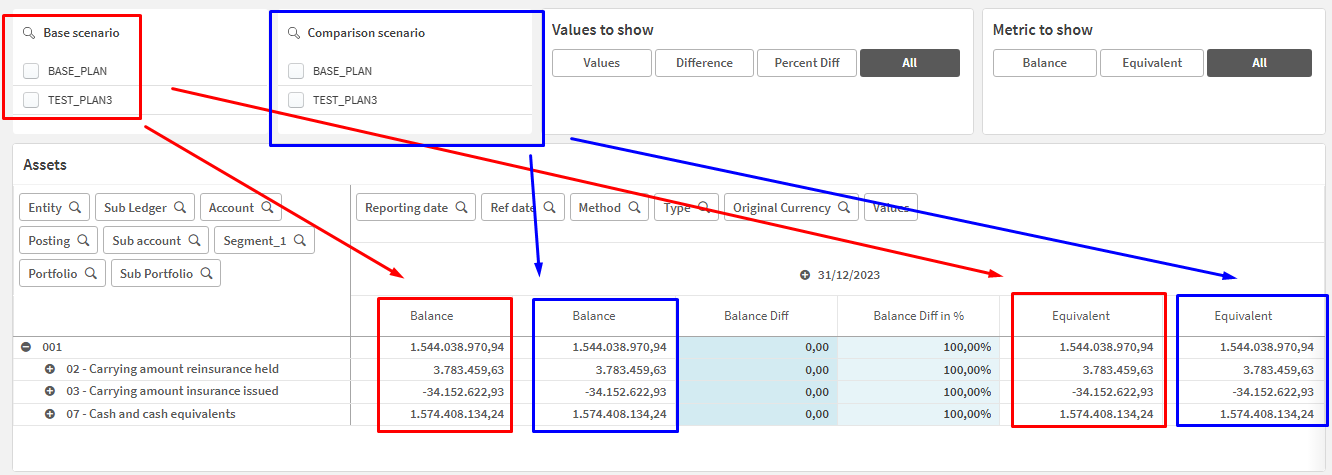
We needed to compare different scenarios and calculate the differences between them.
However, since there can be too many metrics, it’s easy to get overwhelmed.
That’s why we needed a system to filter them efficiently.
*Note Base scenario and Comparison scenario are Alternative states of same attribute
First filter
Second filter
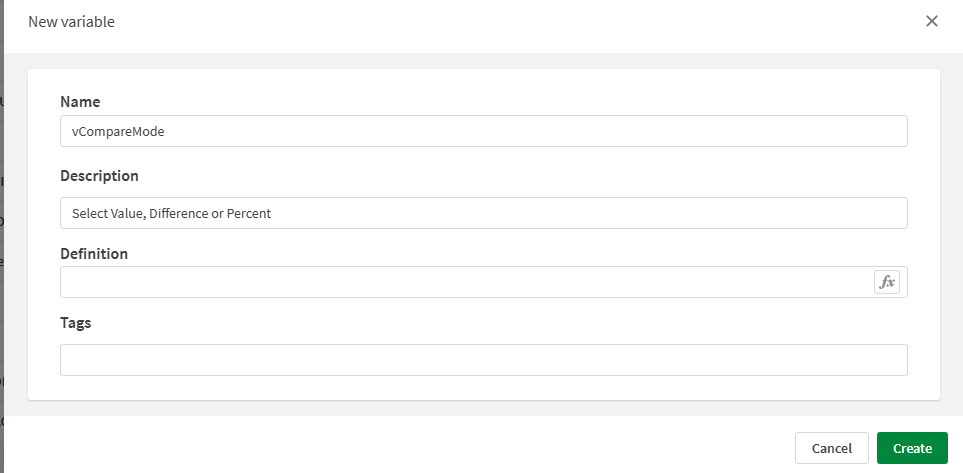
Create new variable that will be used for metric selection
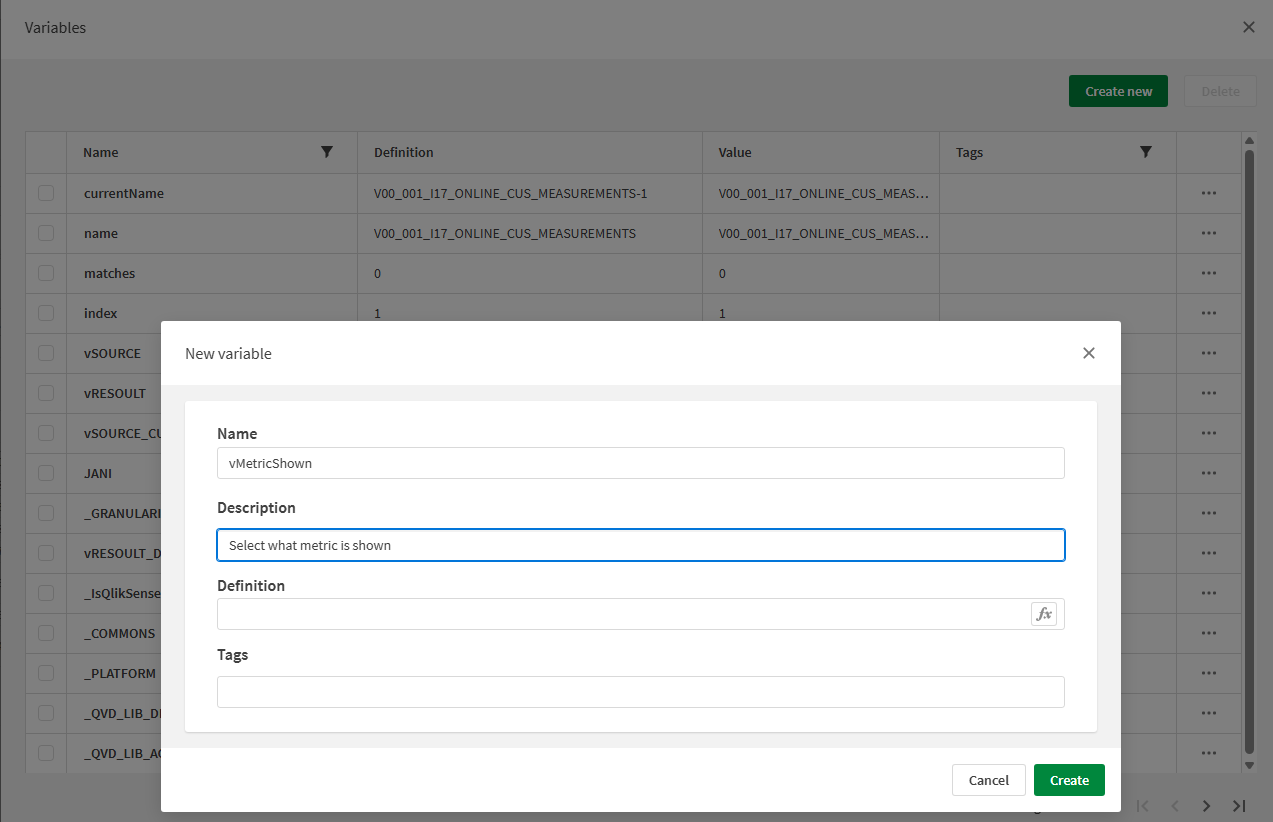
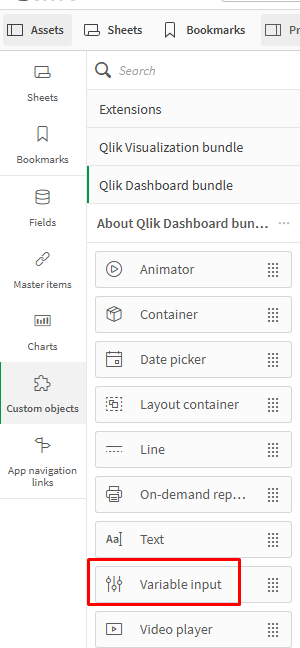
From object select ‘Variable input’
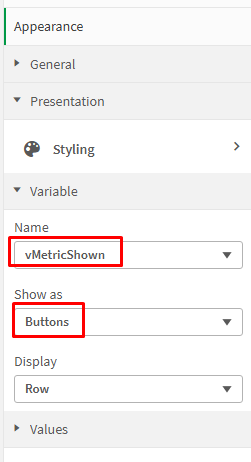
Give it previously defined variable name and select how you want to show it.
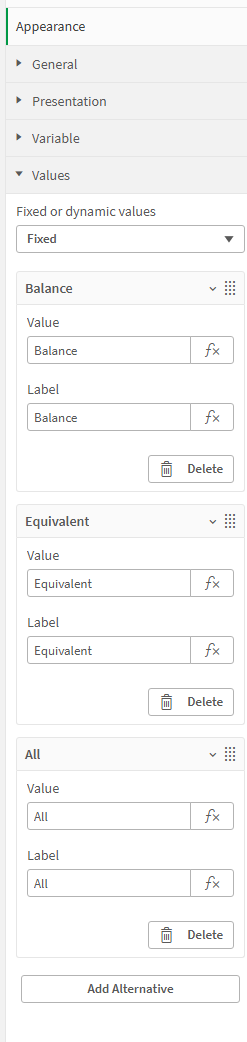
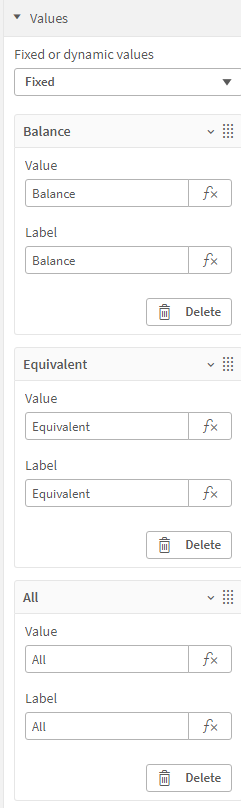
Define possible values you will display in the filter.
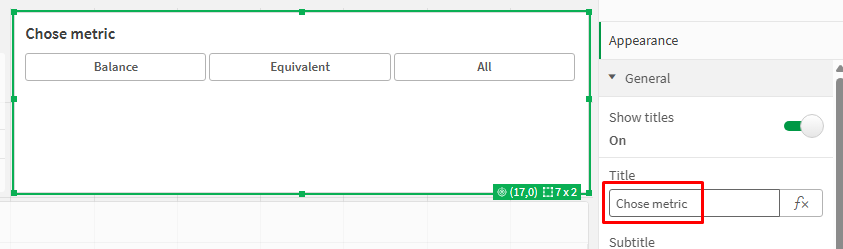
Define filter name
Before continuing, let’s make a small test to see if everything is working.
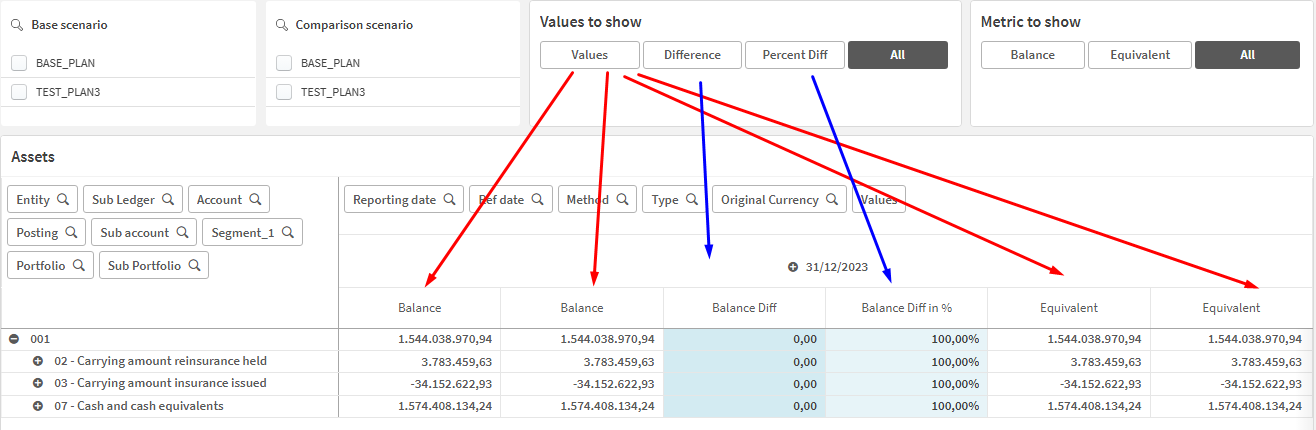
The definition for the first metric, in this case “Balance,” should be shown if the filter selection is “Balance” or “All.”
So, change the “Show column if” setting to:
WildMatch(vMetricShown, 'Balance', 'All')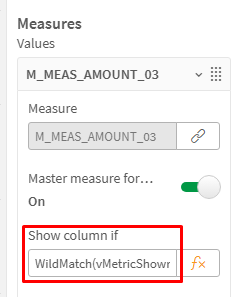
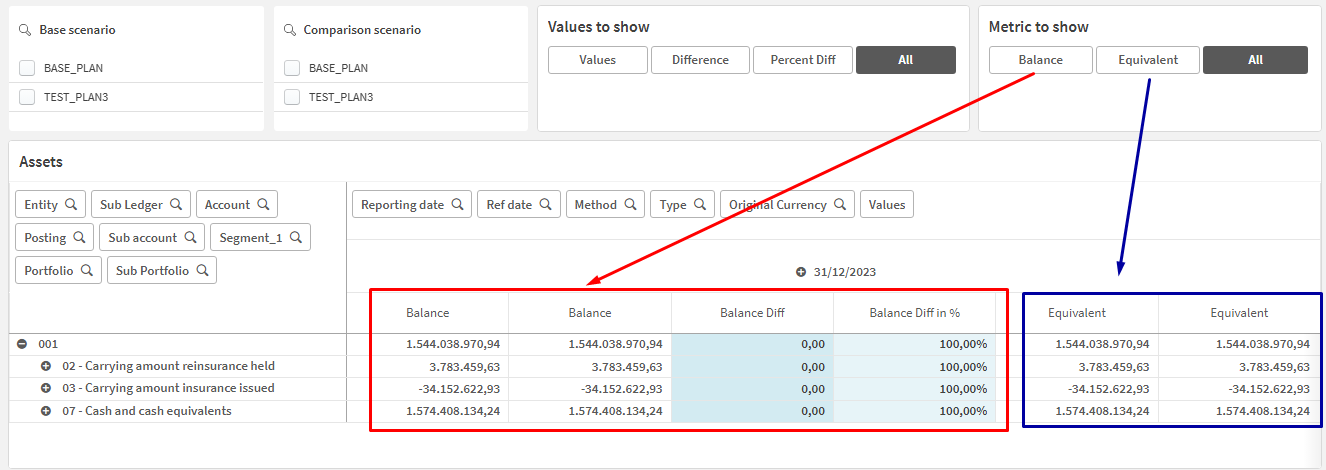
Create the second variable
Create new ‘Variable input’ and
define posible values that you are going to show in filter.
Change the optin ‘Show column if’ for first metric to
WildMatch(vMetricShown, 'Balance', 'All') and WildMatch(vCompareMode, 'Values', 'All')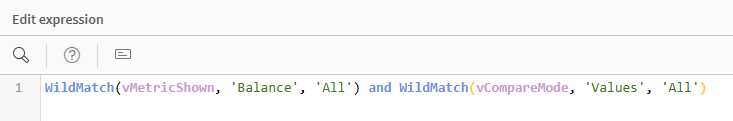
*Optional step
In the load script, set the default variable state when opening the document
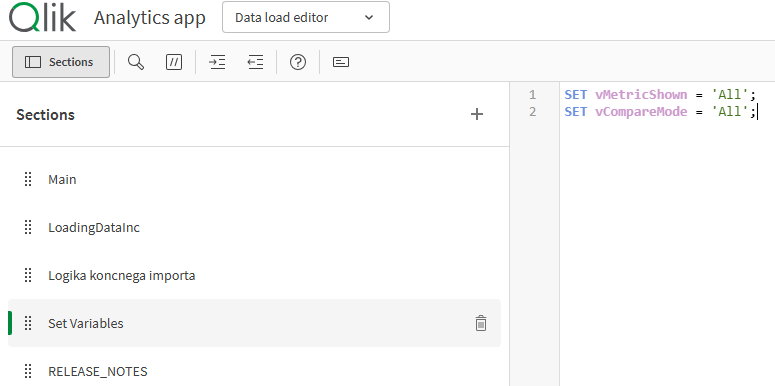
SET vMetricShown = 'All';
SET vCompareMode = 'All';
Additionally
If you want to filter other attributes normally don’t forget to put ‘* $’ in metric definition after alternative state.
Sum({[Alt BASE scenario] * $ } if(IsNull(MEAS_AMOUNT_01), 0, MEAS_AMOUNT_01))